Role
Manager, User Experience
Company
Expedia Group
Opportunity
Revenue managers, tasked with maximizing hotel revenue, constantly analyze market data, including events and seasonal trends, along with other factors influencing bookings.
They use these to inform their room rate pricing decisions.
The room rate data was maintained on a giant excel sheet, and regular adjustments were made based on market analysis and an event calendar.
How might we make it efficient and easy for revenue managers to manage their room rates in one place?
Discovery
Understanding the critical importance of data, we partnered with a few hotels to obtain their data. By integrating their data with market trends, event information, and weather data, we built a machine learning model capable of predicting market occupancy and recommending optimal rates.
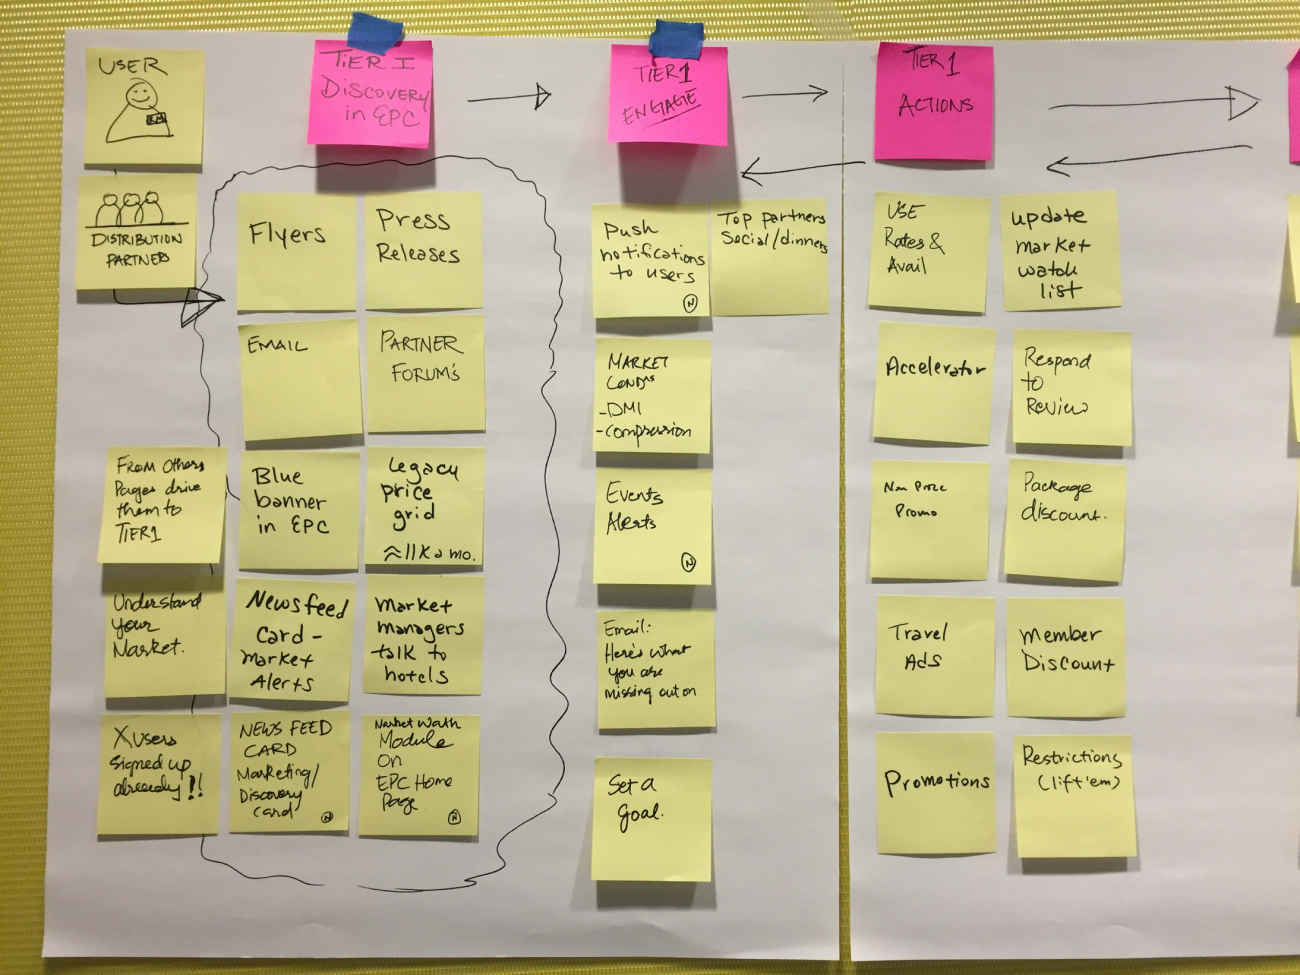
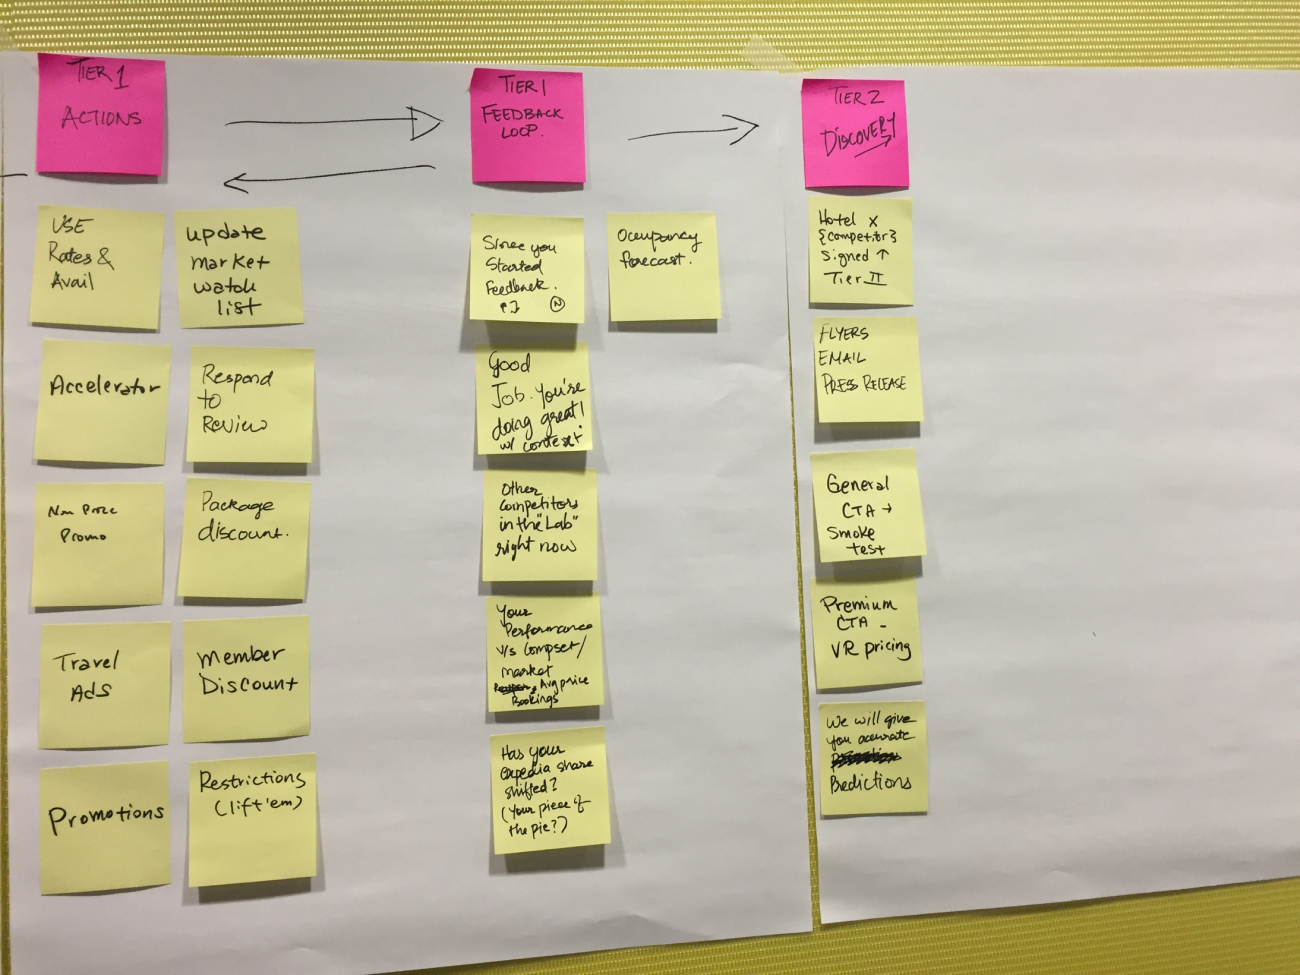
Brainstorming
At the inception of this project, I facilitated a brainstorming sessions with a cross-functional team. We delved into user goals, user needs, solution hypotheses and established key milestones.
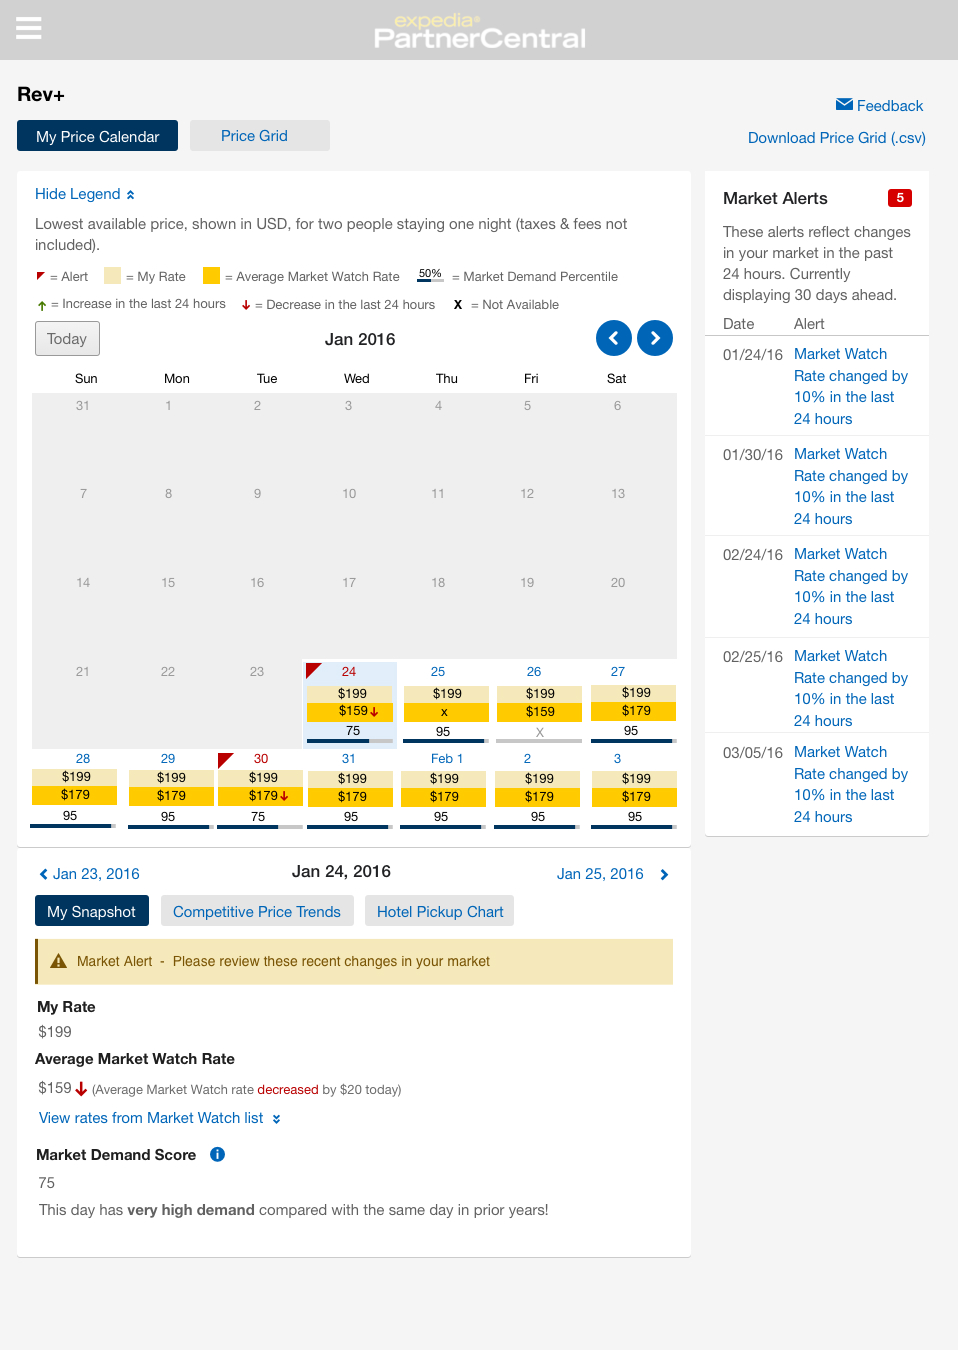
MVP 1 - Go to market
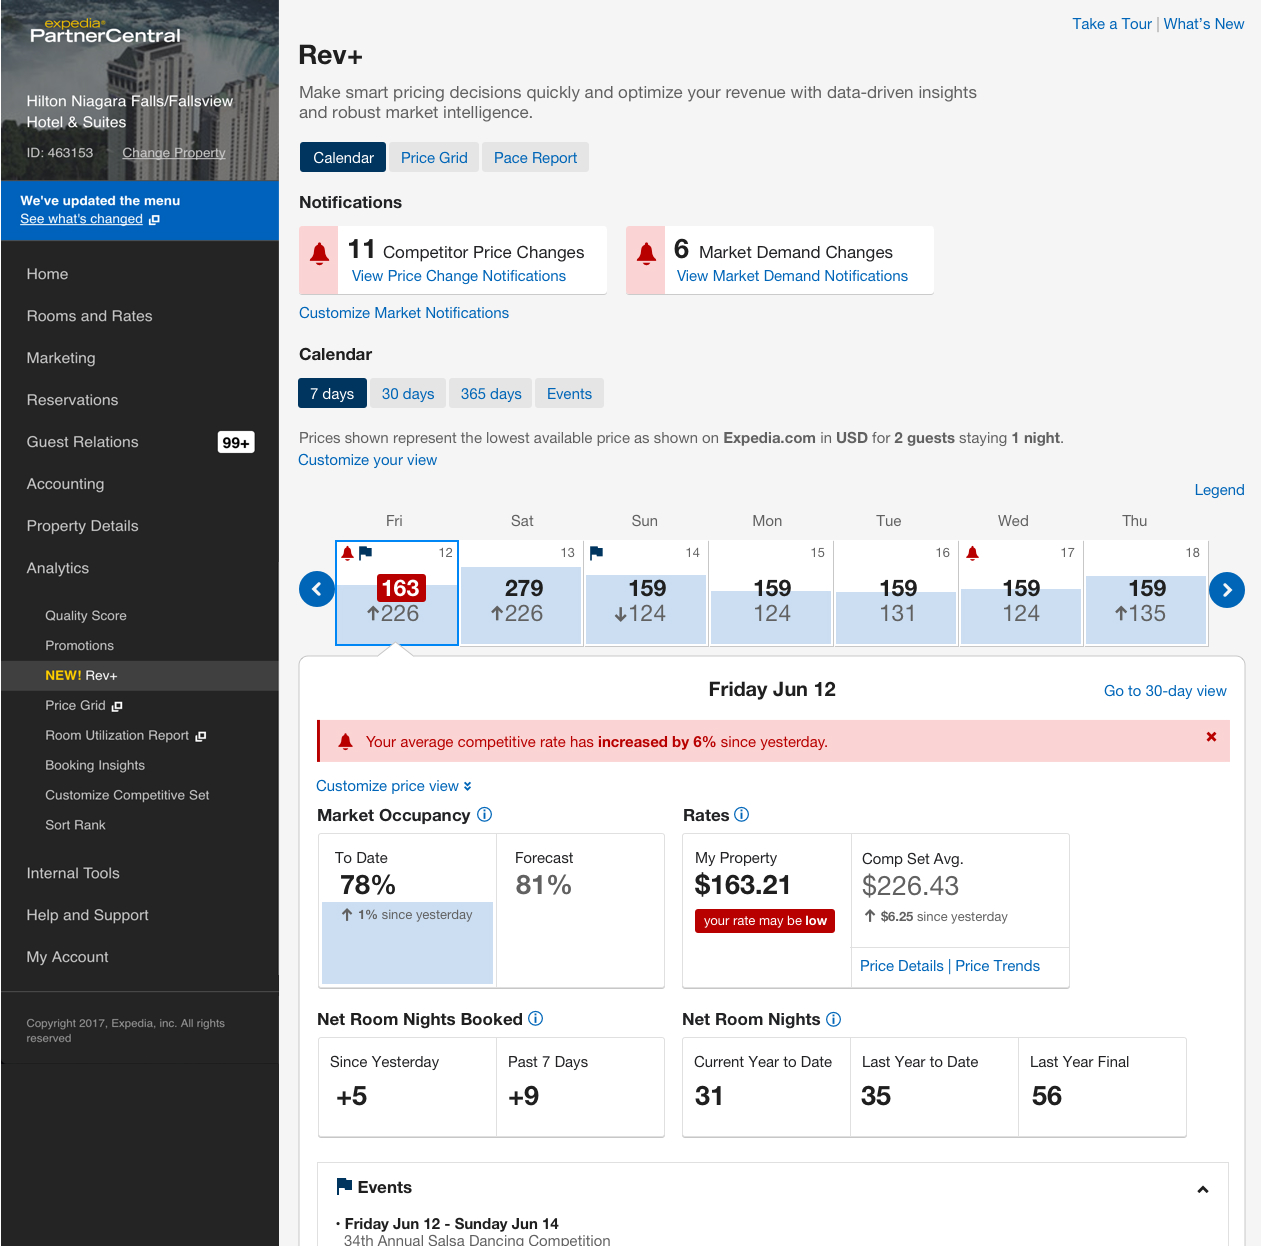
In the initial phase, we recognized that revenue managers relied on calendars and Excel sheets. We designed the MVP to address the needs of a select group of pilot users, enabling us to collect initial data.
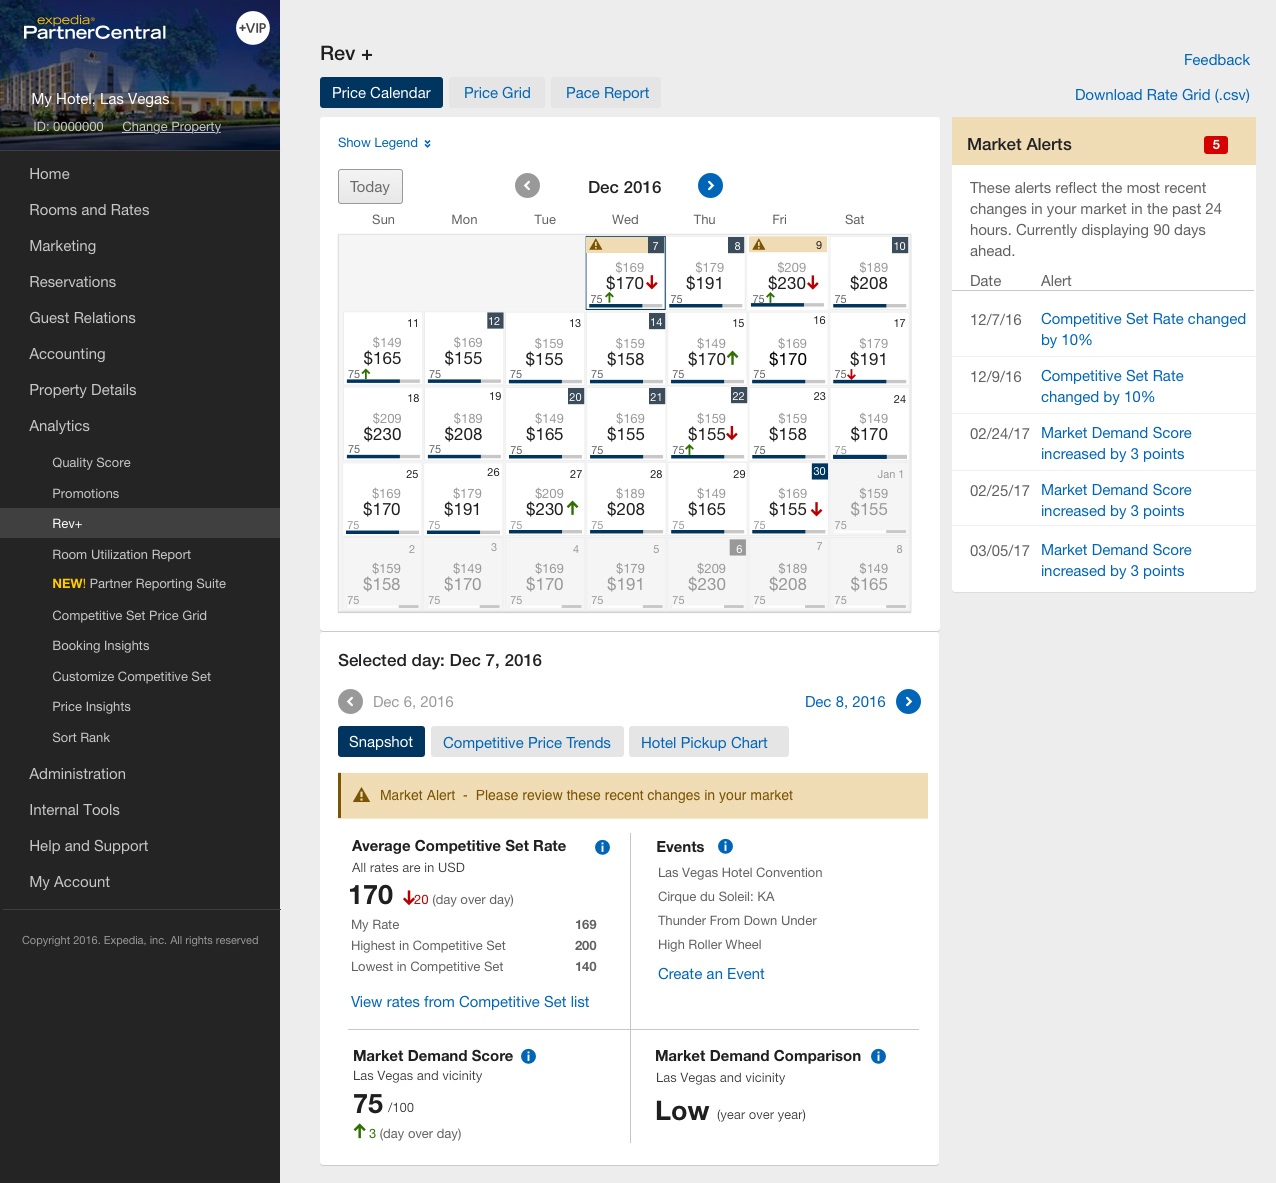
V2 - Improve on the pilot
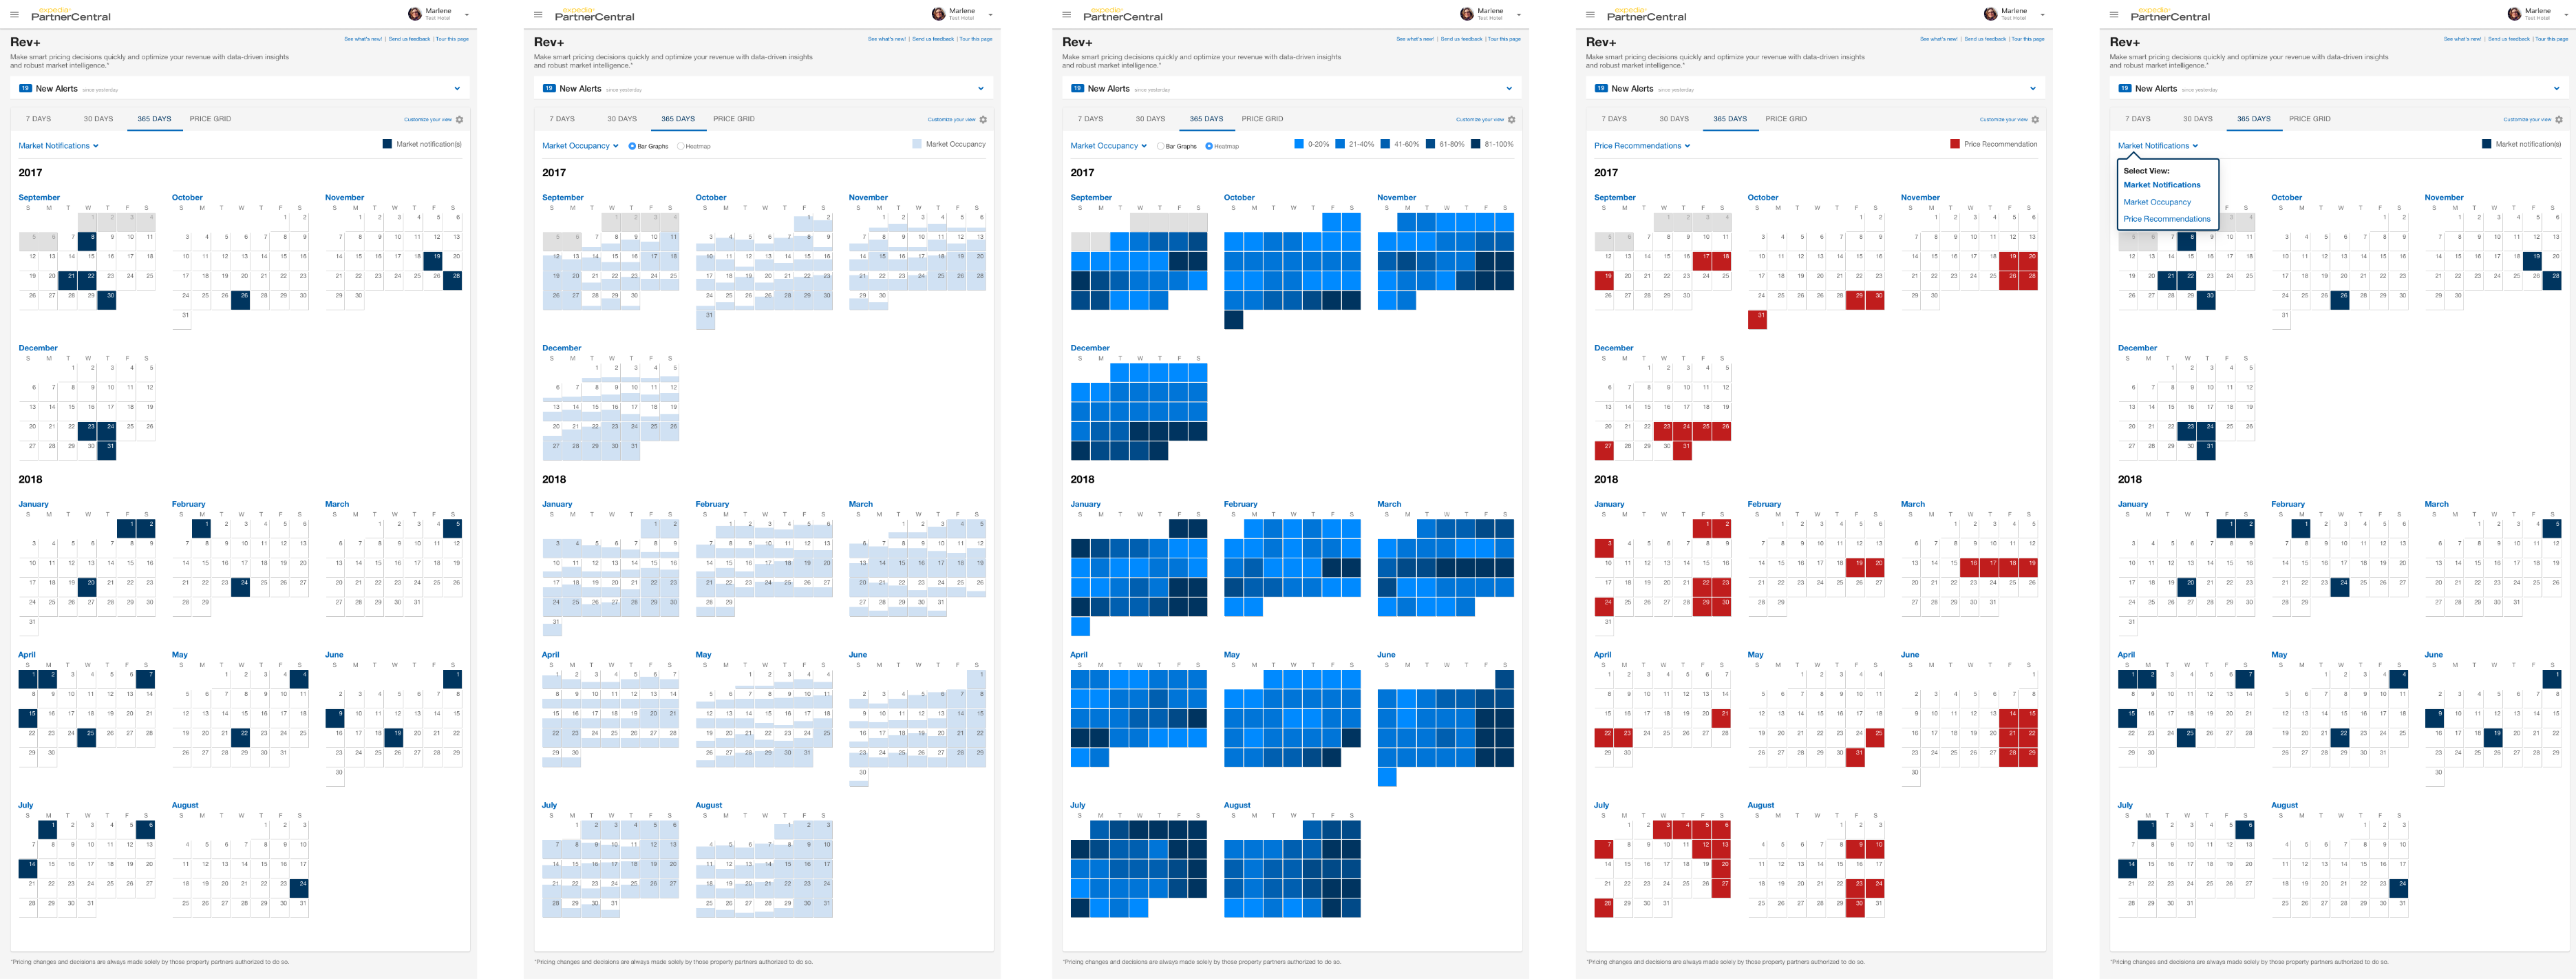
Our initial hypothesis about the calendar view was spot on. However, with MVP 1, we learned that the colors were too intense, making it difficult to read the data. We toned down the colors and shifted the focus to the data, which significantly improved users' ability to analyze their data.
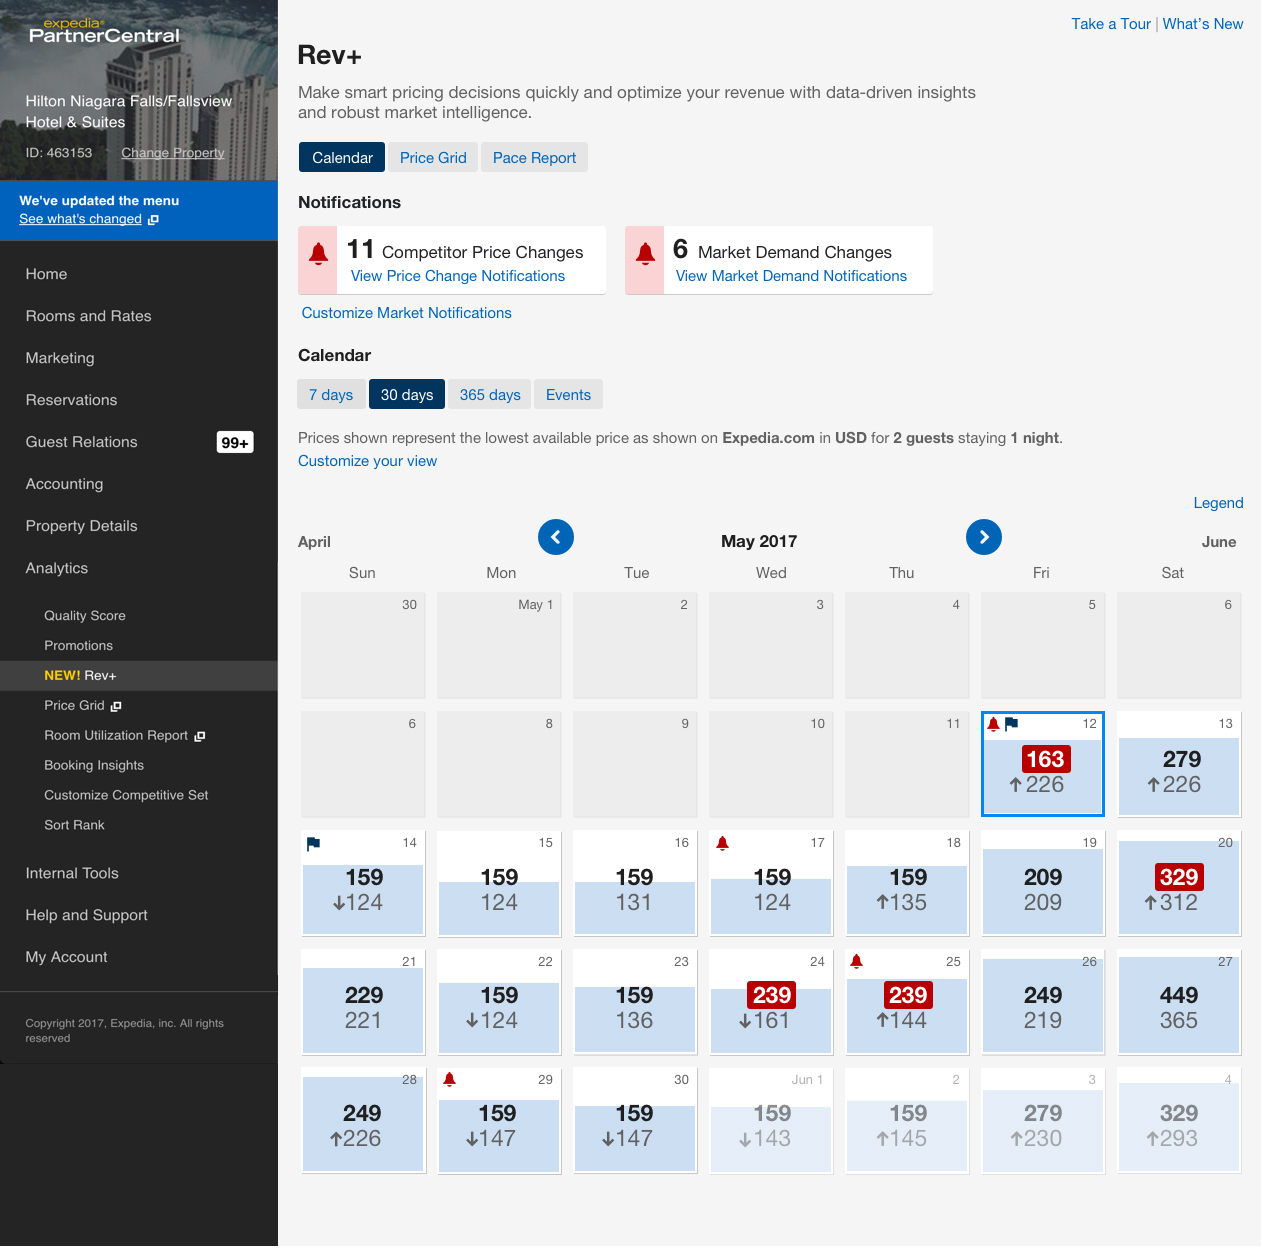
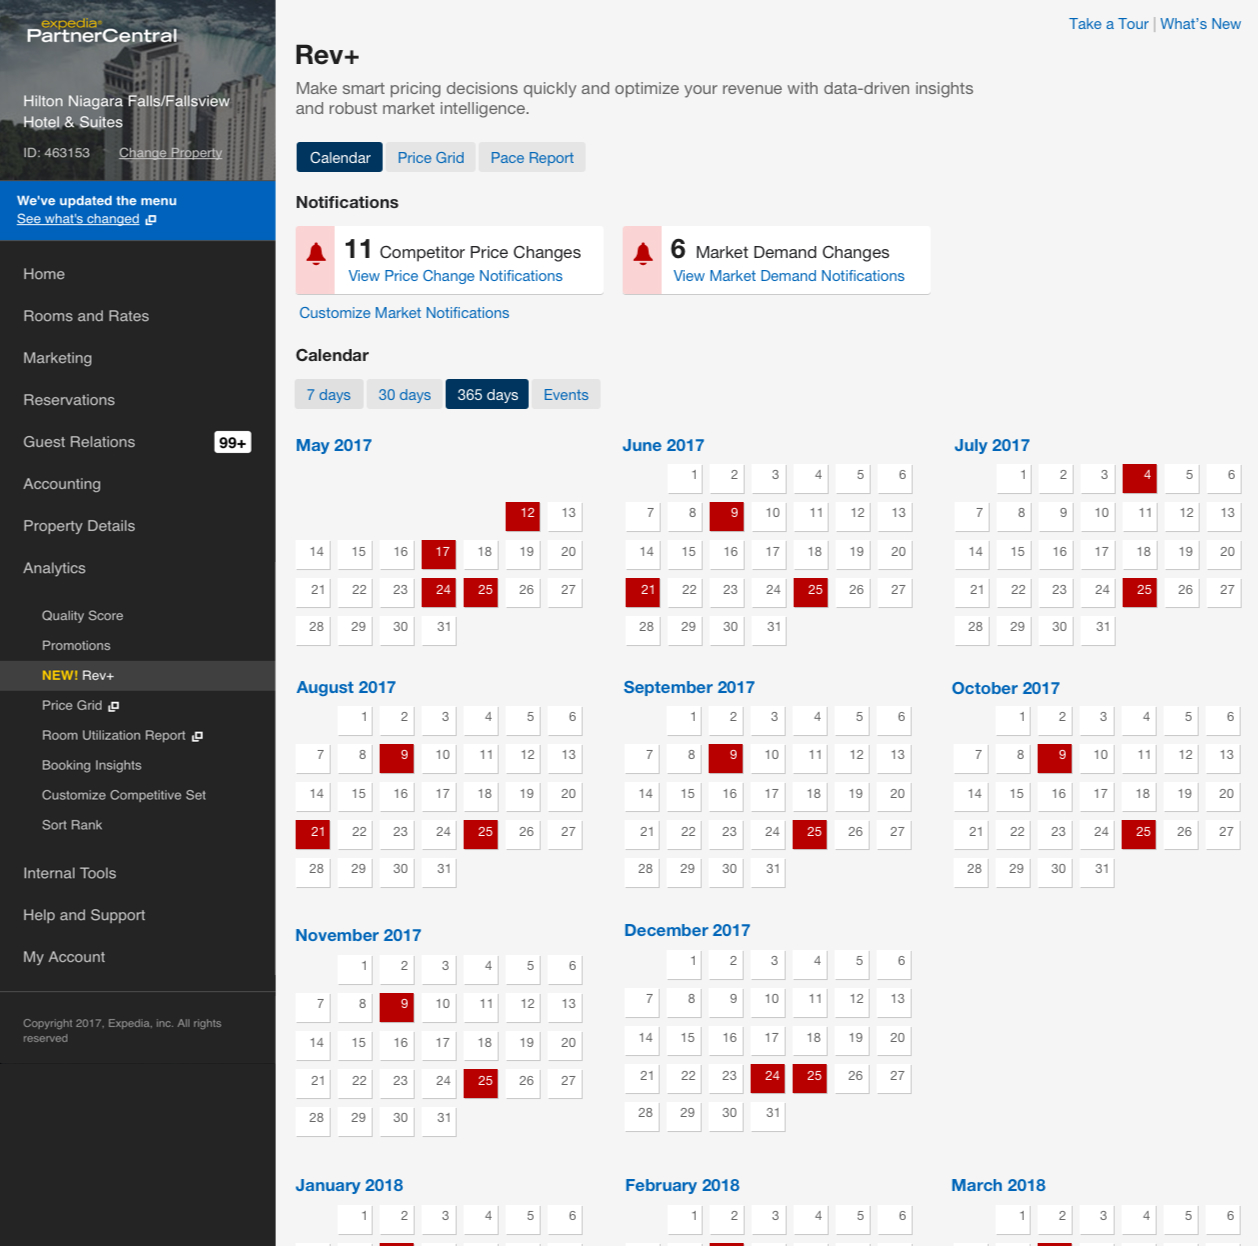
V3 - Drive engagement
Through the first two versions, we learned a great deal about how users interacted with the interface and their key Jobs To Be Done (JTBD). This insight led us to develop both zoomed-in and zoomed-out calendar views, which were very well received by a now larger group of users
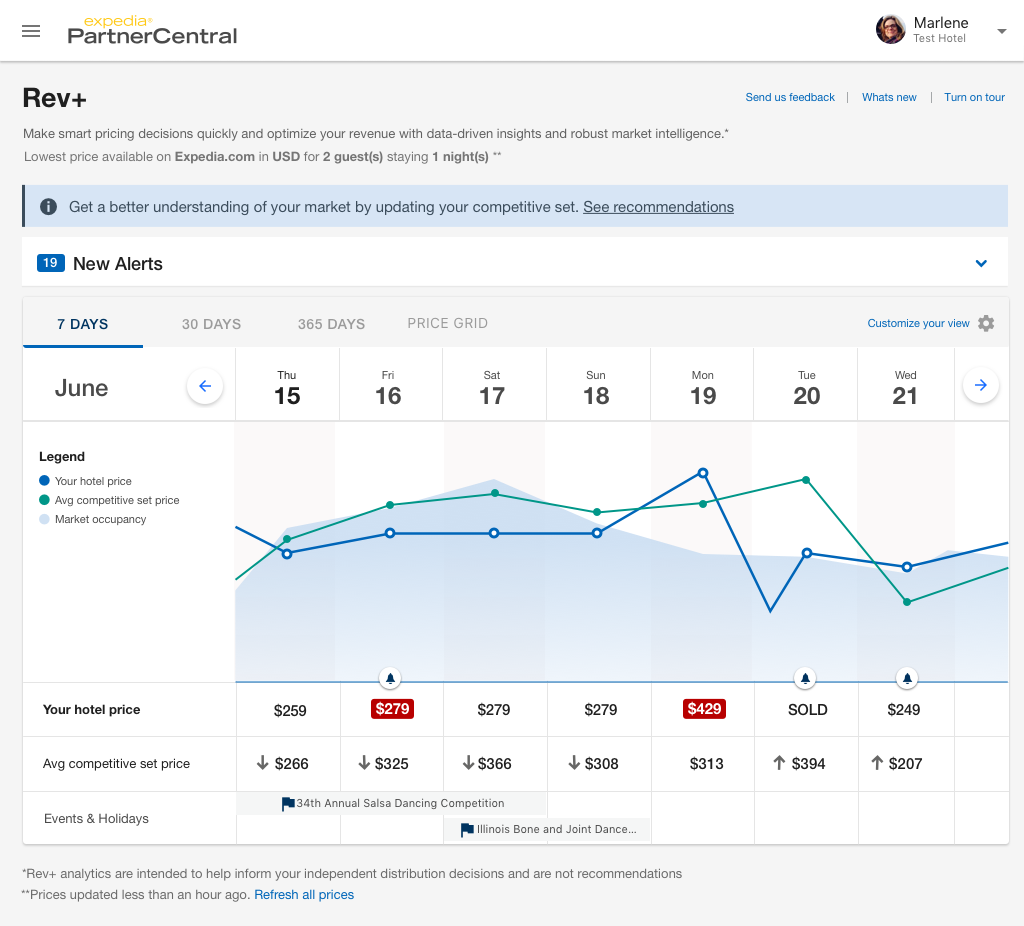
V4 - Optimize
From the learnings of the previous version, we discovered that user engagement was primarily centered around analysis. To enhance this, we introduced an interactive graph feature that helped users focus and perform deeper analyses.
We also developed an interface that integrated graph and calendar data, making it much easier for users to read and interpret the information.
Conclusion
Seeing the revenue management product evolve from initial discovery through multiple iterations has been an incredibly rewarding journey. Each phase brought new insights, allowing us to refine the product to better meet user needs.
Witnessing the significant value users gained from each enhancement was particularly gratifying.